Tutorial - Crafting input with zynamics BinNavi
Crafting input to reach a particular location in the code is a
frequent task one encounters in security analysis. Perhaps a particular
location in the executable has been pinpointed by a static analysis
tool, perhaps the use of a tool like
BinDiff leads one to
think a particular location could be "interesting" if reached with the
proper inputs.
In the following, we will show that a particular integer overflow
patched in
MS08-062 was not actually dangerous: A potential integer
overflow was patched, but we will see that there appears to be no way to
trigger this particular integer overflow.
We have used BinDiff (or a similar tool) to compare the patched against
the unpatched version, and suspect that the following code might be one
of the security vulnerabilities fixed in this update:
5FEFF0DB shr   esi, byte 10
5FEFF0DE inc   esi
5FEFF0DF shl   esi, byte 10
5FEFF0E2 add   esi, eax
5FEFF0E4 push  esi // int
5FEFF0E5 push  eax // int
5FEFF0E6 push  ds:[ebx+0x18] // void
5FEFF0E9 mov   ss:[ebp+arg_0], esi
5FEFF0EC call  cs:_webRealloc@12
5FEFF0F1 cmp   eax, edi
5FEFF0F3 jz    byte cs:loc_5FEFF167
The right-shift-left-shift trickery has been replaced by prudent
checking for integer overflows in the patched version - so it is
reasonable to assume that this particular location needs to be reached
with a malicious value of 0xFFFFFFFF in ESI.
We also know that msw3prt.dll is an ISAPI component - and that ISAPI
components "begin" their active life in a function call "HttpExtensionProc".
Our goal can now be formulated as follows:
Construct malicious input that triggers the memory corruption problem discussed above.
In doing so, we will get to know some of the core features of BinNavi.
Creating a project
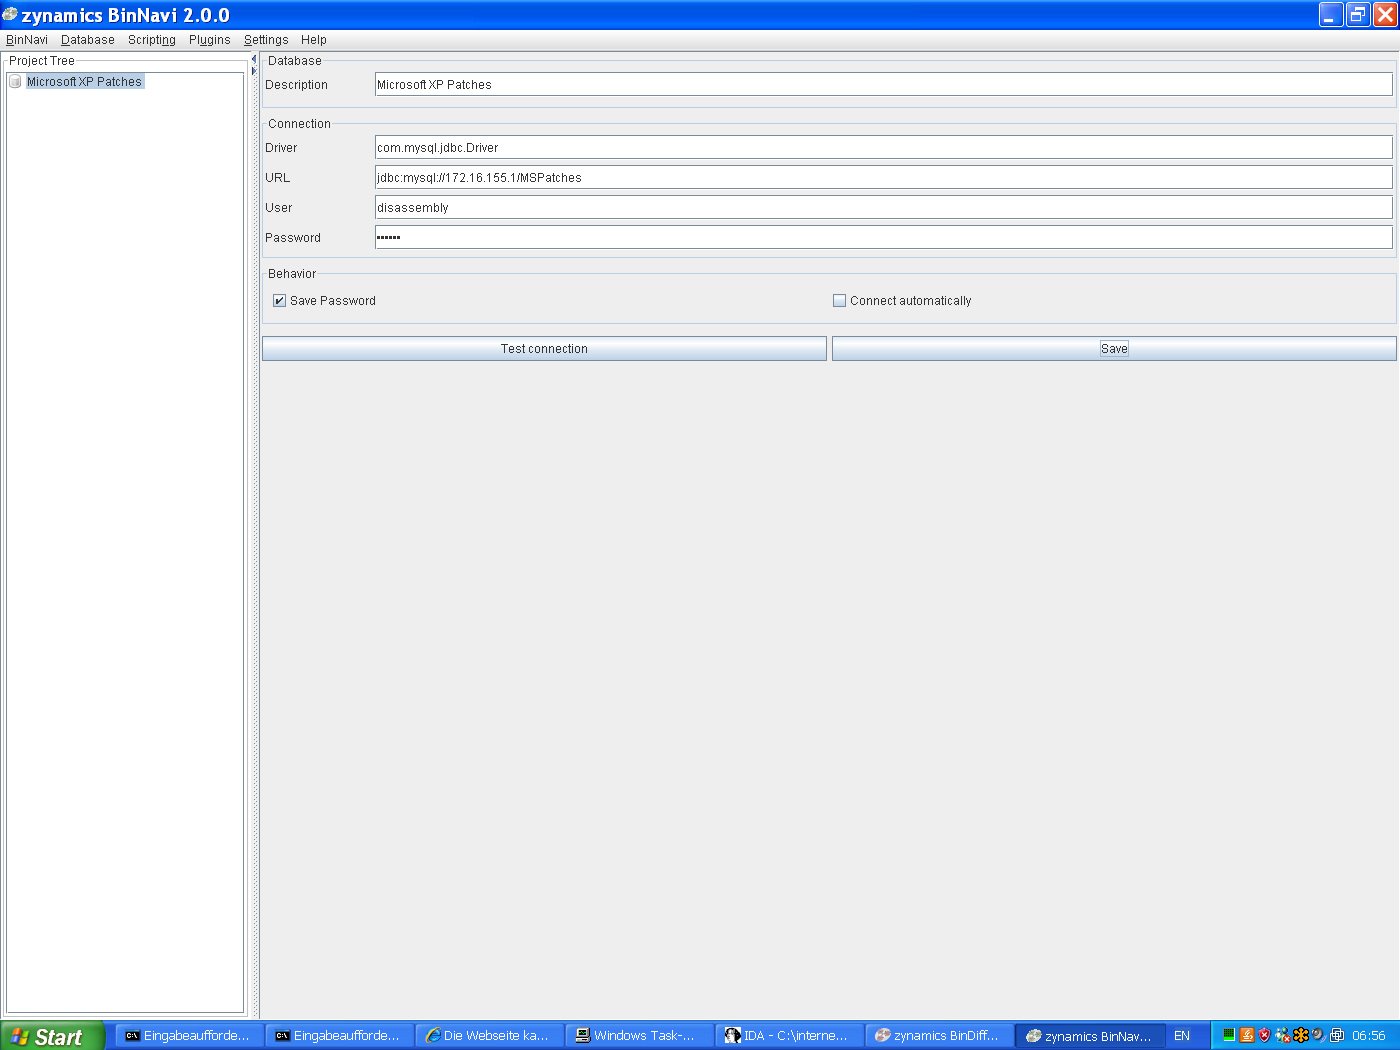
Assuming that you have created and configured access to your central disassembly storage (e.g. the PostgreSQL server), your screen should look somewhat like this (click on the picture to enlarge it):
As a first step, we will now create a new project in which we will work.
Right-click on the database you wish to use, and click
Connect. Once
you are connected, right-click on Projects, and create a new project
named "MS08-62-.printer integer overflow". This is where we will keep
all data related to this particular vulnerability.
BinNavi supports multiple address spaces per project - this is useful in
many scenarios, for example when a vulnerability involves complicated
interactions between processes. For our purposes, the default address
space will do though.
Now, as next step, we need to import the disassembly of the file we're dealing with into our database. This is done via right-clicking on Raw Modules and selecting Import Raw Module. We then select the IDA database msw3prt.idb. BinNavi will launch an instance of IDA in the background, and the disassembly will be imported into the database in the zynamics core database format (see documentation) intended to be used by all sorts of reverse engineering tools.
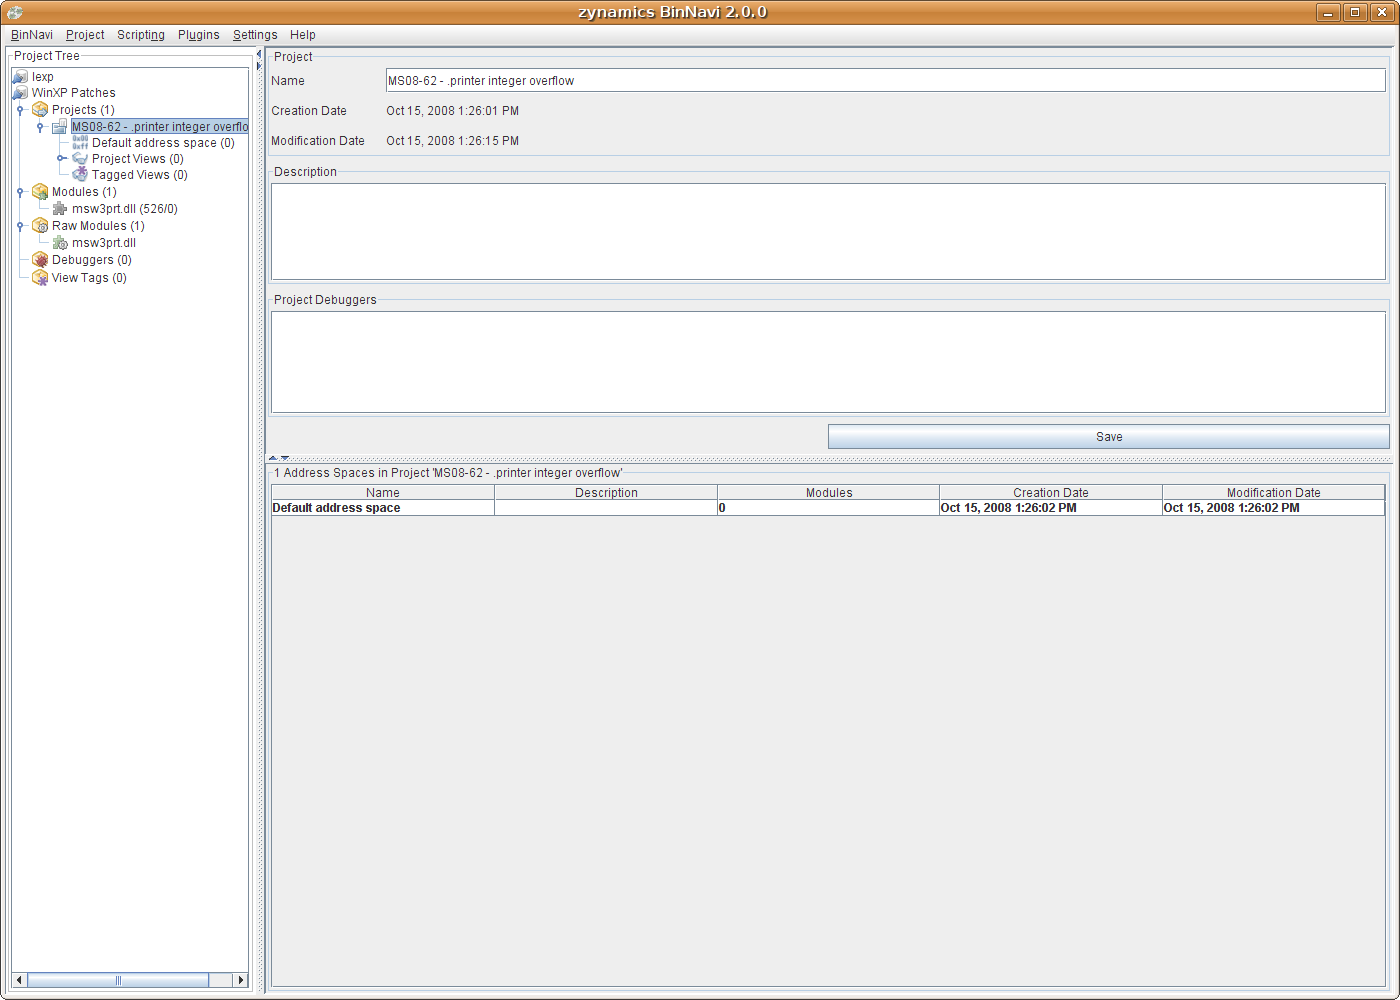
Before BinNavi can use this data though, it needs to perform some minor conversions - for this, please right-click on the raw module you just imported, and convert it to a BinNavi module. Your screen should now look something like this:
Now, since we wish to work with msw3prt.dll, we need to make sure
that this DLL is mapped into our default address space. You can just
drag & drop arbitrary DLLs from the "modules" tree into your address
space.
So, let's get to work.
In order to open the callgraph of the DLL we're working with, click on
the "Default address space->msw3prt.dll" field. Do a right-click-open on
the "native callgraph" entry in the middle of your screen.
Your screen should look roughly like the following:
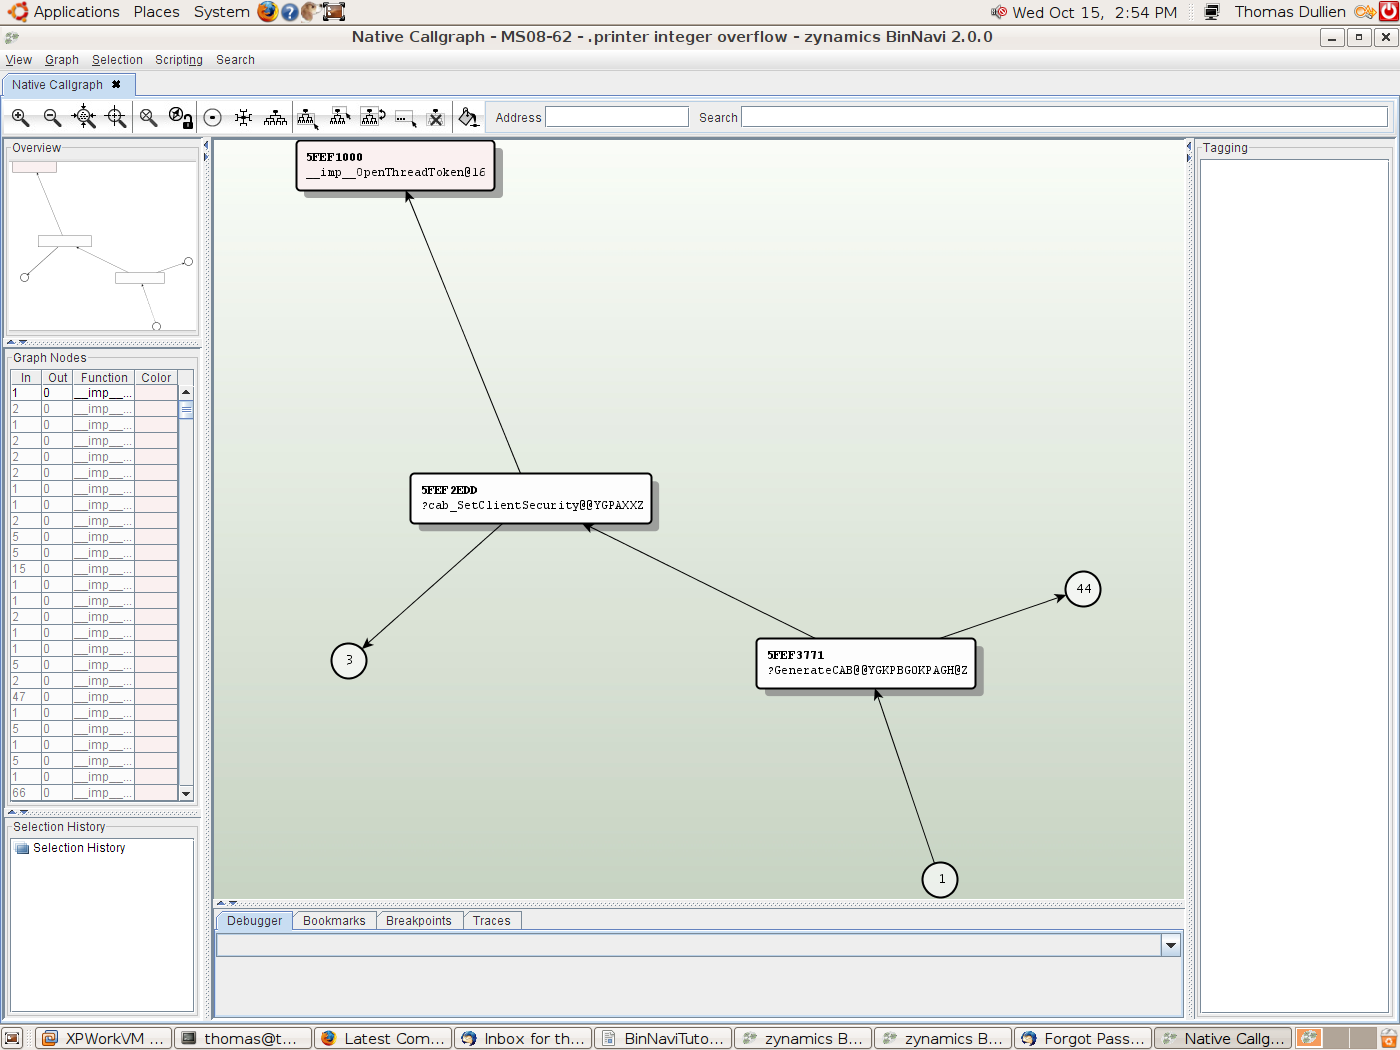
You probably have worked through the Usage->Graph Window chapter of this manual. We will nonetheless spend a few minutes getting used to the user interface before we focus on constructing a path through the executable again.
"Surfing" through the callgraph
Proximity browsing coupled with the "Undo Selection" and "Redo
Selection"-hotkeys allows "surfing" through the callgraph in a rather
comfortable manner. Please position your cursor in the search field and
type "HttpExtensionProc" followed by "Enter". The node with this name
will be made visible, the graph layout will be recalculated, and the
node in which the search string was found will be centered on screen.
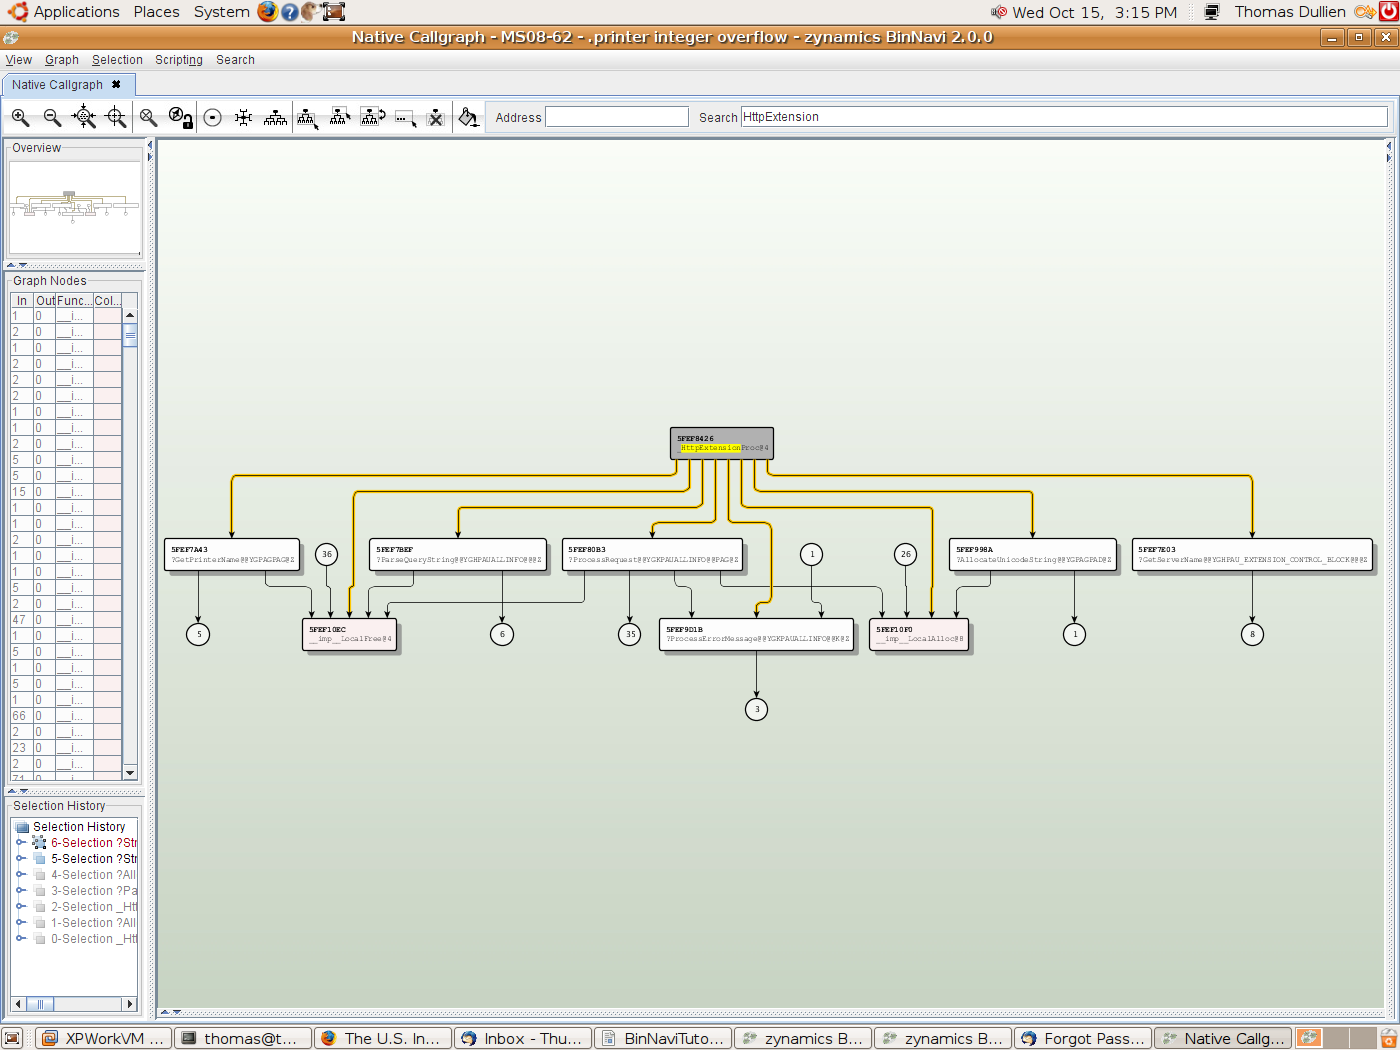
Click on the HttpExtensionProc node to select it, and click on the
"hierarchical layout" button to have the layout recalculated.
Your screen should look somewhat like this:
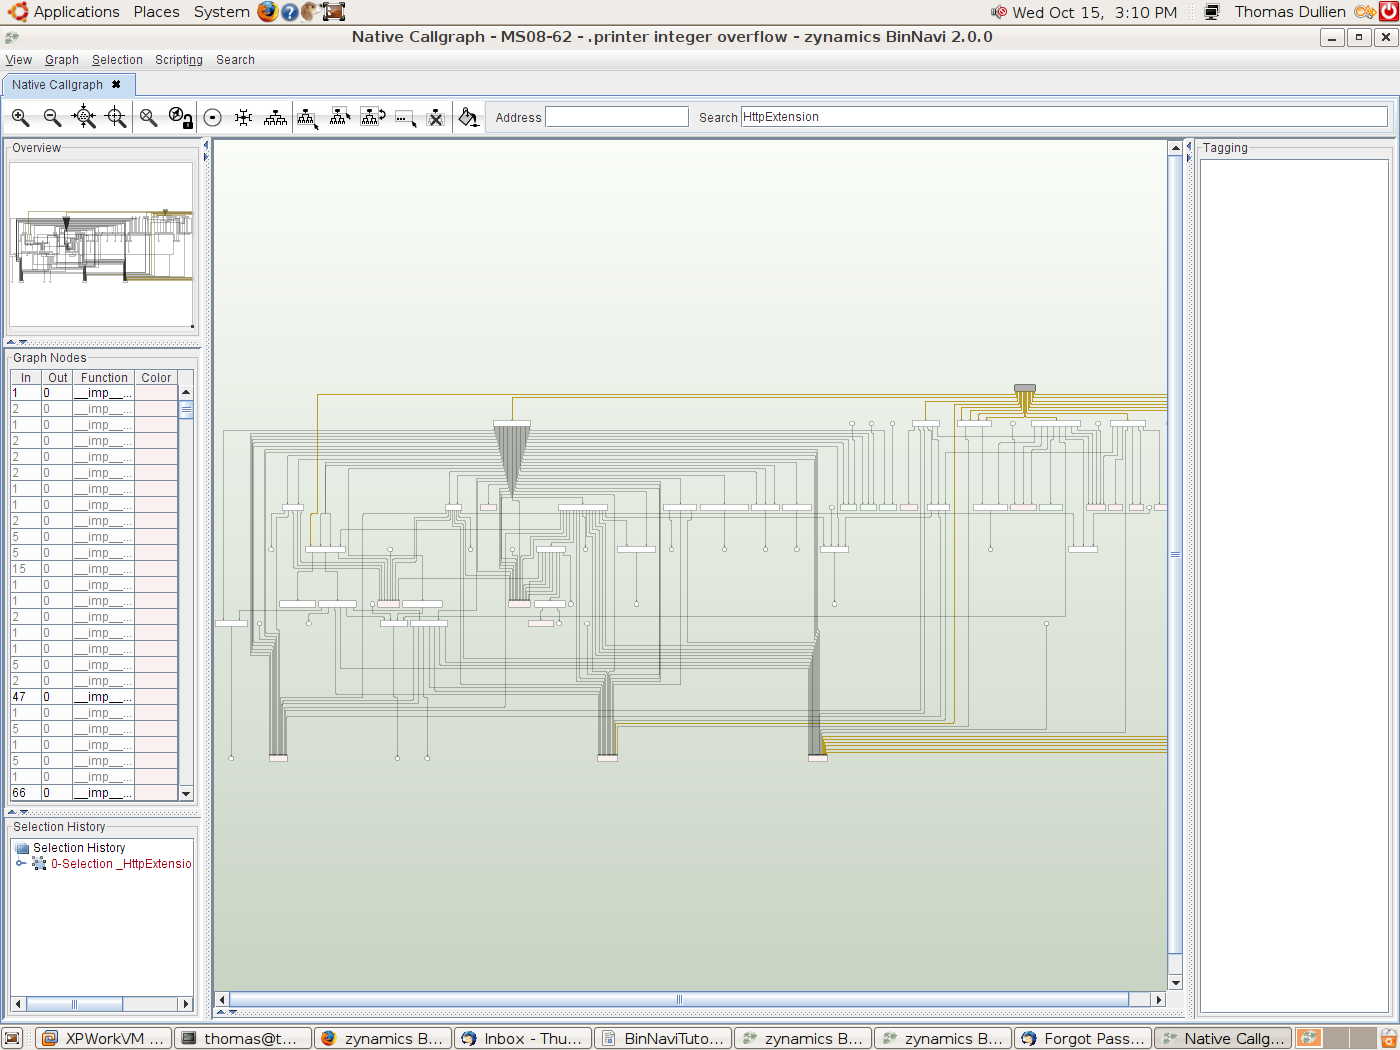
By default, the proximity browsing settings are configured so that all nodes within a distance of two "hops" from your selection are made visible. While this is useful for many scenarios, we want to change this for the callgraph "surfing" we're about to do. Please go to Graph->Proximity Browsing Settings and set both slides to 1. After you click OK, your screen should look roughly like this:
Our goal is now to understand the way we need to navigate from HttpExtensionProc to WebIppRcvData. In order to do this, please begin by clicking on the "hierarchical layout" button.
Now click on the node labeled "?ParseQueryString". This node will become selected and centered, with its immediate neighbors arranged around it. Please left-click the "?AllocString"-node now, and then left-click the "?StringCbCopy"-node, and finally, the "?StringCopyWorker"-node. You have just traversed the callgraph from the "root" (e.g. HttpExtensionProc) to one of the "leafs". If you hit "CTRL-Z" now, your last selection will be undone - moving you back to the node you had selected before the current selection. Hit "CTRL-Z" again, and again, to arrive at "?ParseQueryString" again.
If you hit "CTRL-Y", your selection is "redone" -- moving forwards again.
By using proximity browsing and the selection undo/redo, you can "surf" through the executable.
Building a path through the executable
In order to build a path through the executable, we will begin by cutting down the callgraph to only those nodes that are of interest to us: Functions somewhere on the way between HttpExtensionProc and WebIppRcvData. Let's isolate these functions:
In the search window, search for WebIppRcvData. Select this node and click on the "select predecessors" button. Now only node sin the graph can lead to WebIppRcvData are selected. If you go to Graph->Delete Unselected Nodes, all nodes that are not on this path will be removed. Your result should look something like this:

This looks rather manageable, eh ? We will not need proximity browsing in such a small graph, therefore we can switch off proximity browsing in the Graph menu. Save this view (View->Save as) Right-click on WebIppRcvData and select Open Function.
The integer overflow in question occurred in basic block at address 0x5FEFF0DB in this function. We will now use the BinNavi Pathfinder plugin to generate a graph that shows us how we need to go about reaching the target address. In order to do this, switch to the database window again, and right-click on the msw3prt.dll module in the "modules" subtree. Your context menu should offer the option of running the Pathfinder plugin. Once you run it, you need to select a start- and endpoint for the path to be generated:

We select the beginning of HttpExtensionProc, and the target basic block 0x5FEFF0DB in WebIppRcvData. After we click OK, a new graphview will have been generated in our address space under msw3prt.dll->Module Views with the name "New Pathfinder View". If you open this view, you should see something like this:
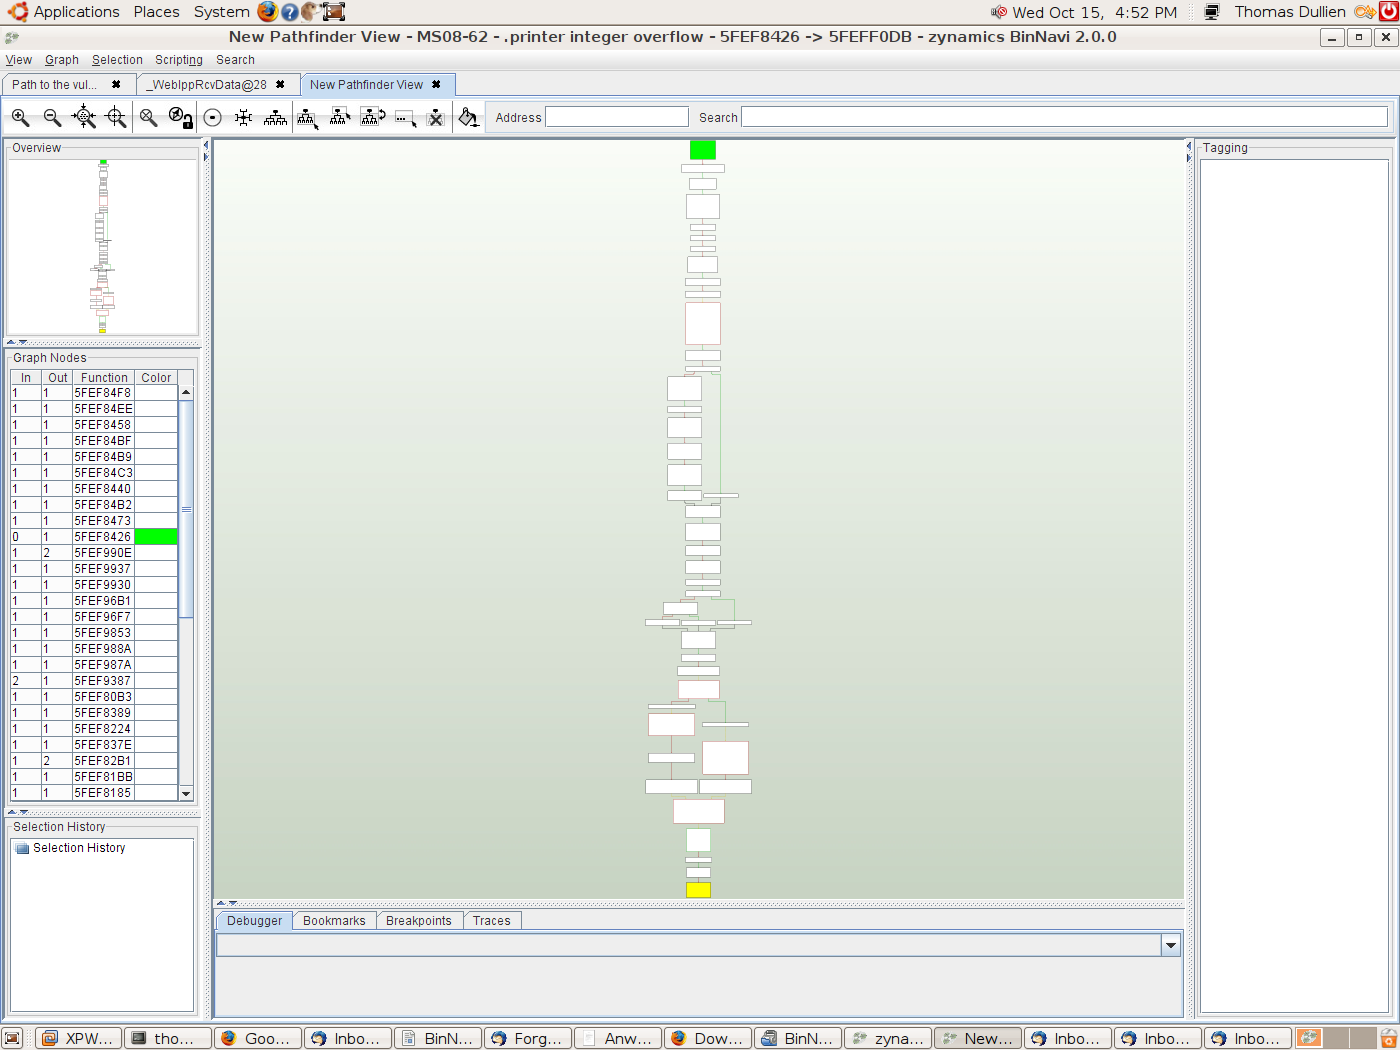
The yellow block is our target block in WebIppRcvData, the green block is the starting point of HttpExtensionProc. This graph will be our "map" when we try to adjust our input to reach the vulnerability.
The first question is, clearly, how far down this path we can already go in "regular" execution. For this, we want to attach a debugger to the process we're targeting and see what we can reach.
Configuring the debugger
BinNavi can communicate with a multitude of different debuggers over the network, each associated with a particular address space. This allows for great flexibility: For example, one could debug a Linux-based client in "lockstep" with a Win32-based server.
In order to configure a debugger for your BinNavi, go to the database window, and right-click on Debuggers. Create a new debugger (I call mine "WinXP VM") and set the IP address and port to the IP address of the machine where the BinNavi debugging agent is going to run.
Click on the MS08-62 project, and enable this debugger for this project by clicking the checkbox. Make sure you click on the "save" button after enabling the debugger.
Please select the default address space, and set the debugger to WinXP
VM. Don't forget to click the save button!
Inside my Windows XP VM, I have enabled printer sharing, and configured
IIS so that the .printer extension is properly passed on to msw3prt.dll.
The debug agent can be found in /BinNavi/debug/win32/client32.exe and is launched by supplying the process ID to be debugged as first argument.
In order to make sure the msw3prt.dll is loaded, we direct our browser
to
http://172.16.155.132/printers/PDFCreator/.printer
Now close your views and reopen the path that was constructed (we need to do that since the views where opened before any debugger was configured). Click on the "connect to debugger" button in the debugger pane at the bottom of the screen. You should be greeted with the following screen:
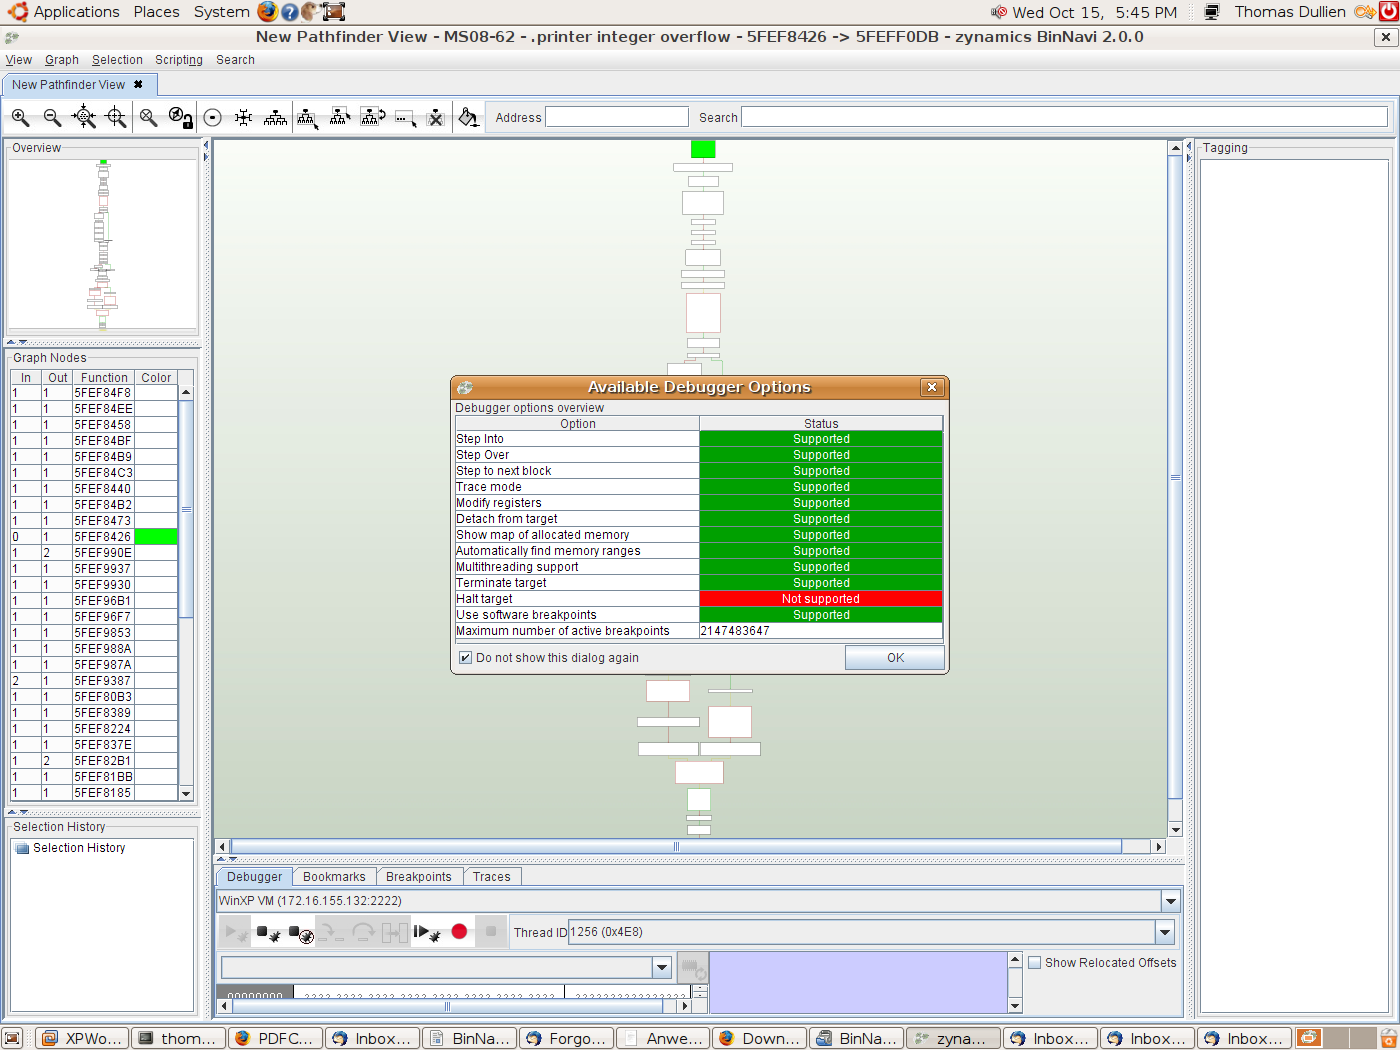
Close the Debugger Options screen by clicking OK, and click on the "big red button" in the debugger pane. This will set breakpoints on all the nodes in the current graph view and allow us to understand which parts of the code we can already execute, and at which point we're taking a "wrong turn".
Now direct your browser to http://172.16.155.132/printers/PDFCreator/.printer again. The code will execute, and any breakpoints hit during this execution will be logged.
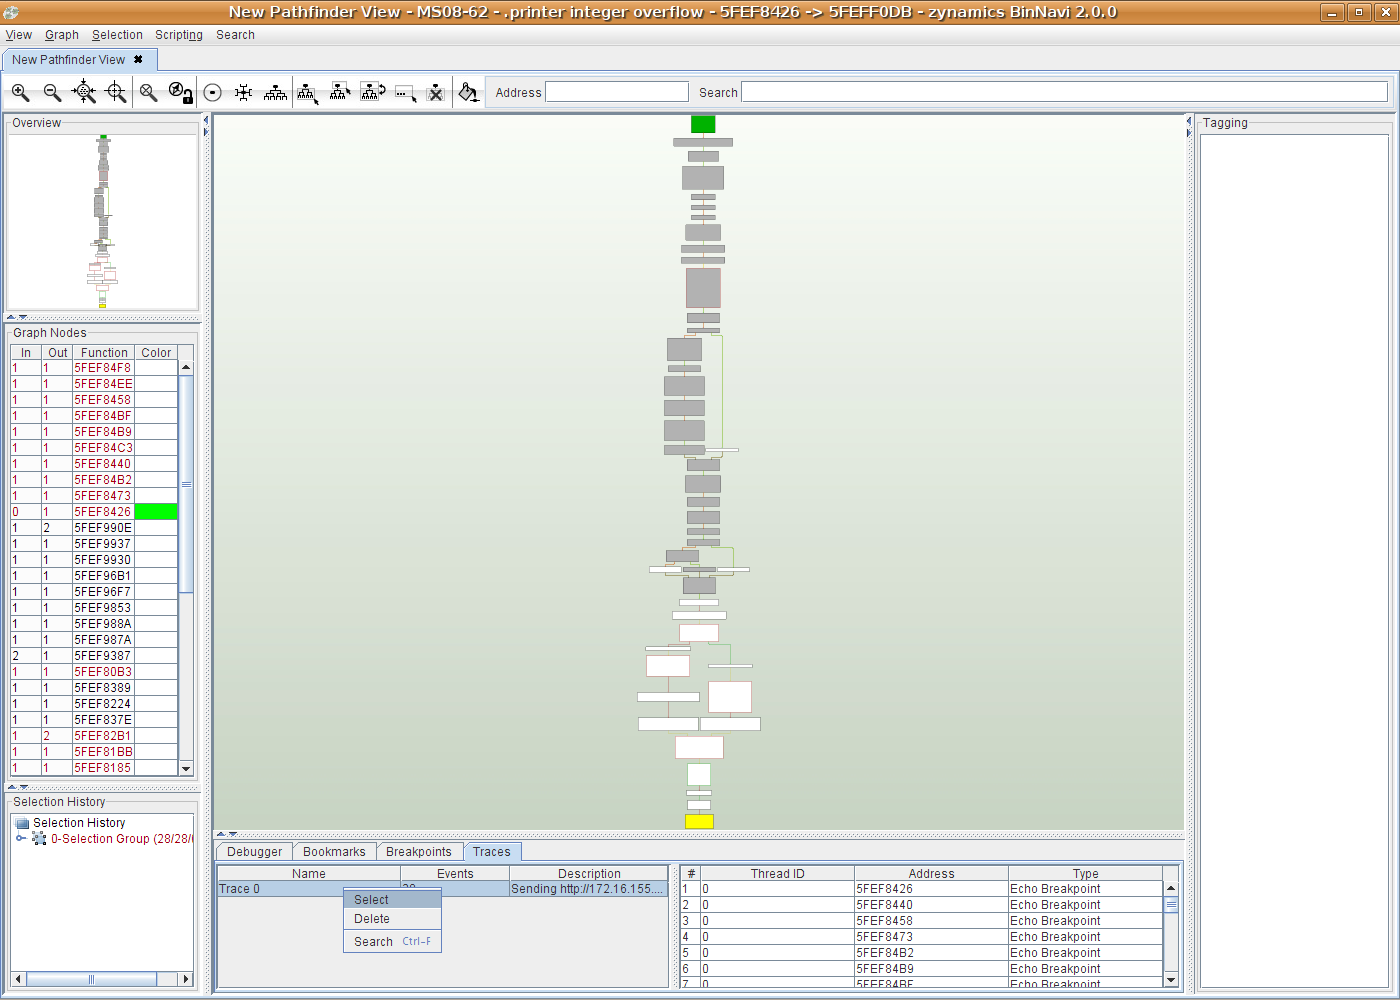
You can visualize which parts of the code you have successfully executed during this trace by clicking on the Traces tab. This tab will list all debug traces you have collected. In this screen, I have added a description to the debug trace (so that I can remember what I did to obtain the trace), and used the context menu to select the nodes executed in this trace.
This screen now tells us exactly where our code execution took a "wrong turn": The last selected node is exactly where we branched in the "wrong" direction. Use the paint bucket to color the currently selected nodes in a light hue of red, and zoom in on the branch we'd like to take.
If you do a shift + right click on any instruction prior to the branch, you will see that the address turns green. This means you've just set a breakpoint on the instruction in question. If you re-send your request now, the debugger should suspend on the location on which you set the breakpoint, and you should be able to inspect the register contents.

Single-stepping once, we can see that EAX contains the value "4" when we would like it to contain the value "1". Where is this value set ? If we search for "var_24" in our graph, we arrive at the following location:
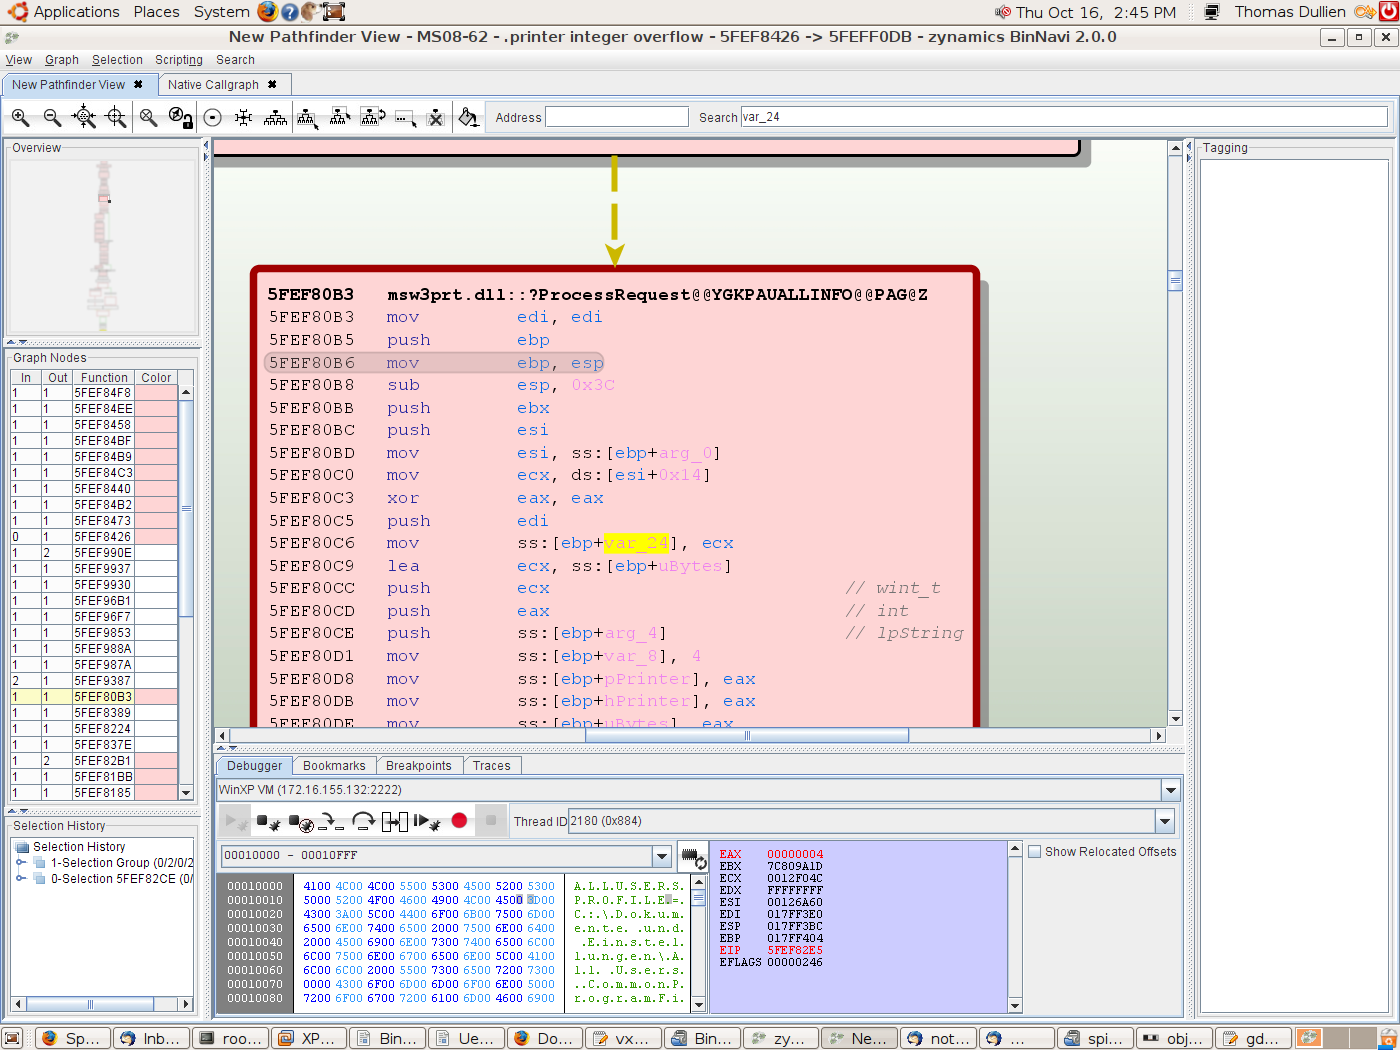
We can see that the value is set to whatever was in arg_0->0x14 - and scrolling up a bit we see that this arg_0 was passed into the current function by a "push esi" at address 0x5FEF84FA, and that it was previously passed to ParseQueryString by these two lines:
5FEF84EE push esi
5FEF84EF call cs:?ParseQueryString@@YGHPAUALLINFO@@@Z
This leads us to the "guess" that the contents of the structure are initialized in said function. It would be nice if we could add this function to our graph, therefore we right-click on the node with the ParseQueryString-call and select "inline subfunction" for it.
The graph then looks like this:
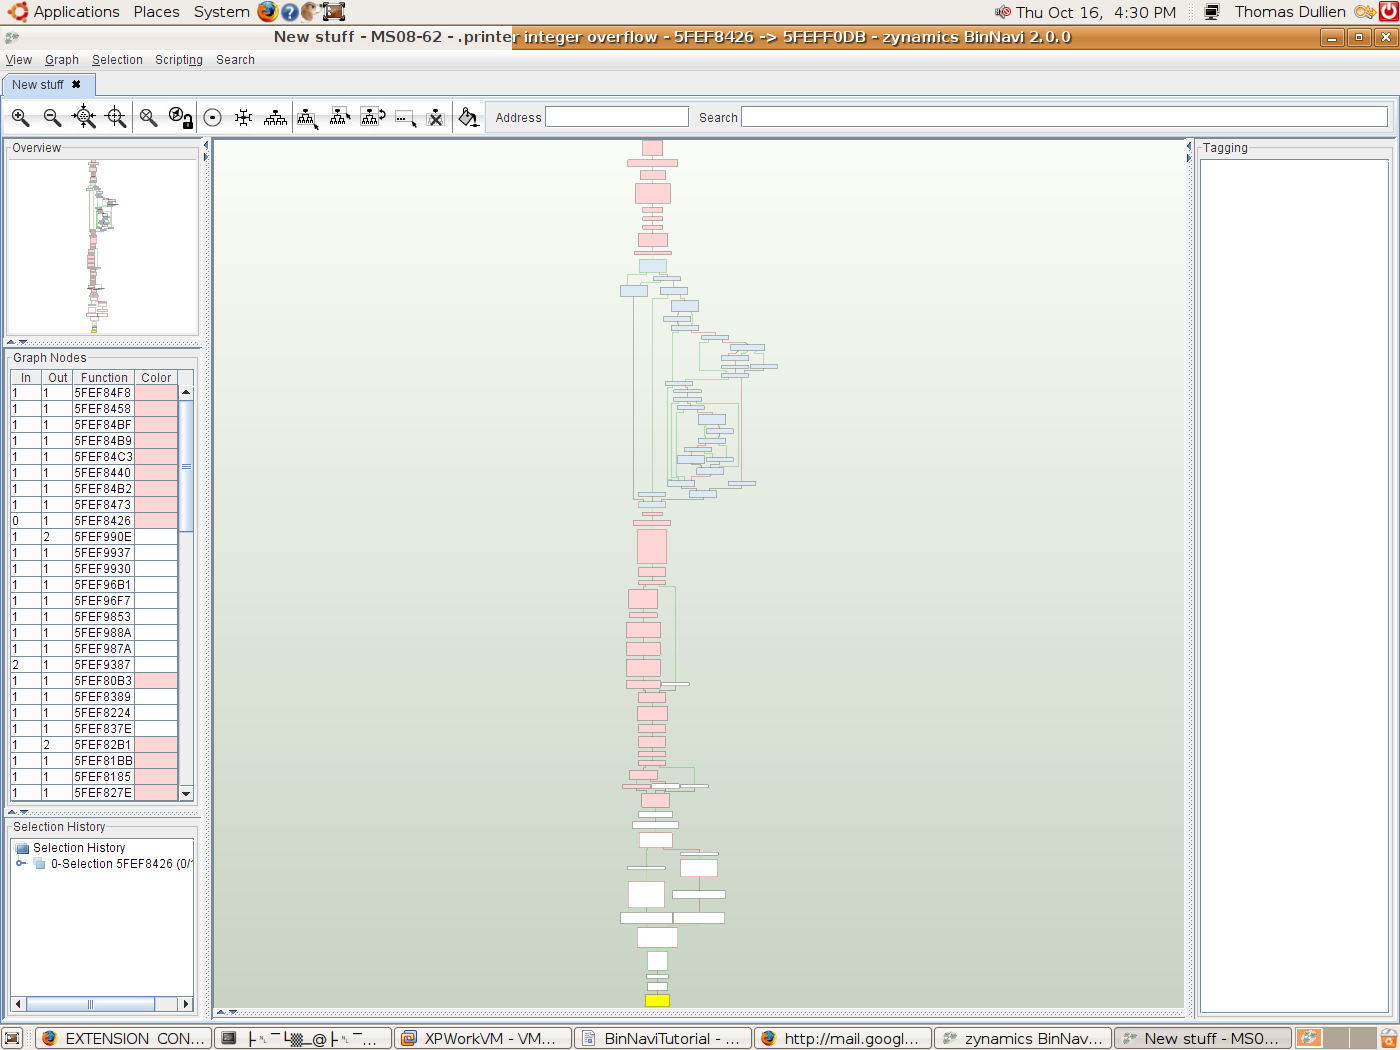
We wish to set the value in question to 1 - so let's search for "0x14" in this graph and see where it might be set. The nicest way to do this is by using the "select by criteria"-dialog:
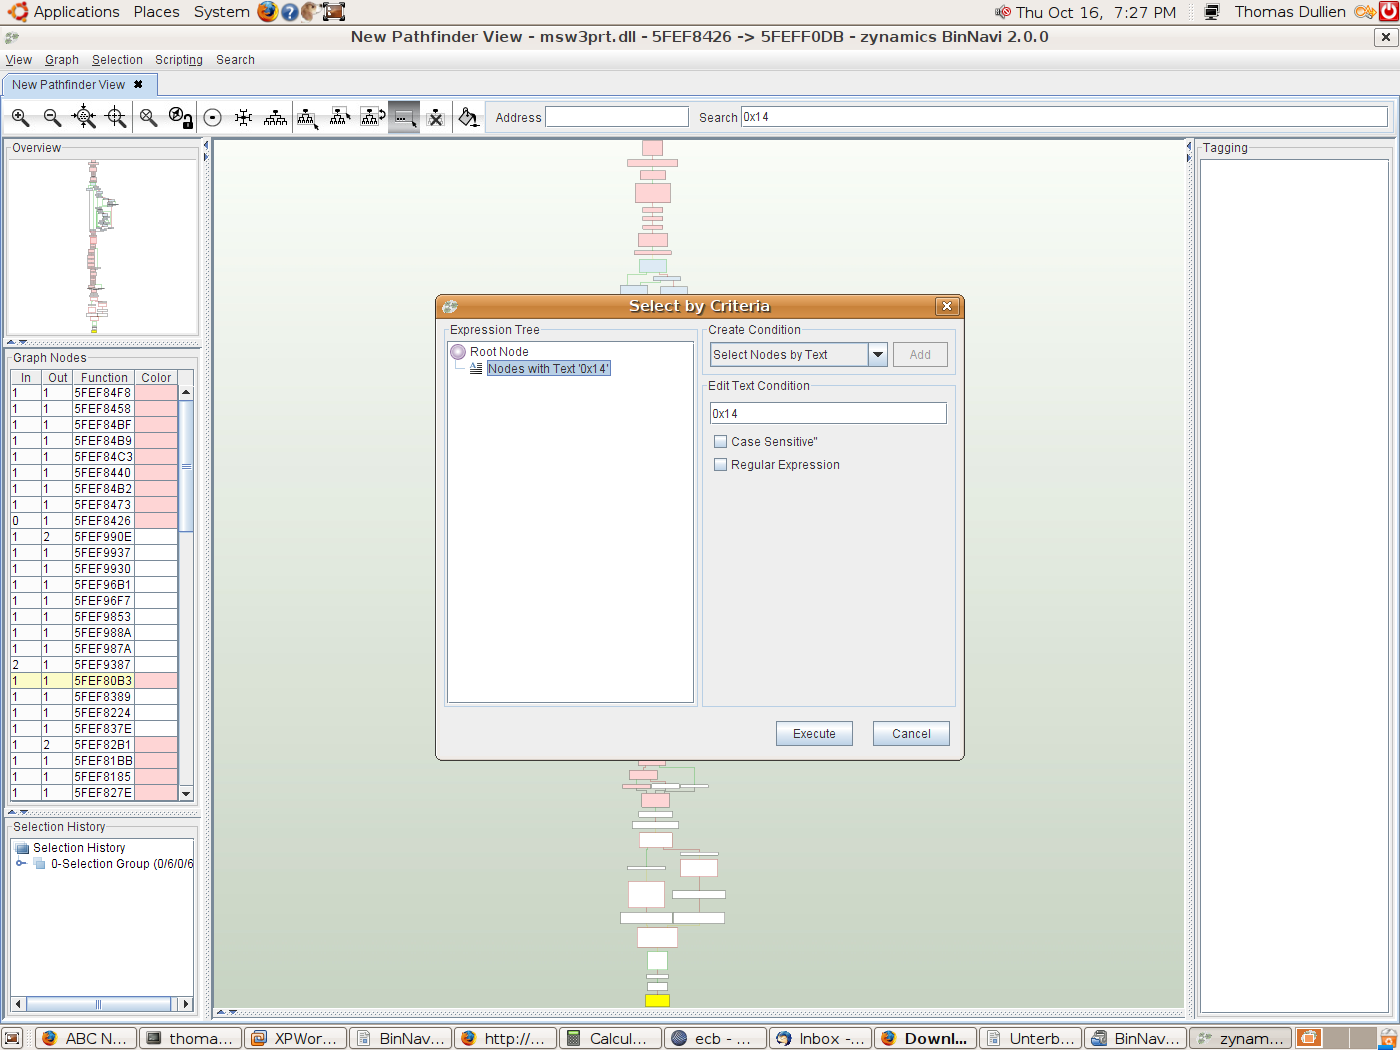
After selecting everything that contains 0x14 and coloring it in a bright yellow, the graph looks like this:

We will collect another trace in this graph with the same request, and select it again. This will immediately locate us the location at which the value in question was set:
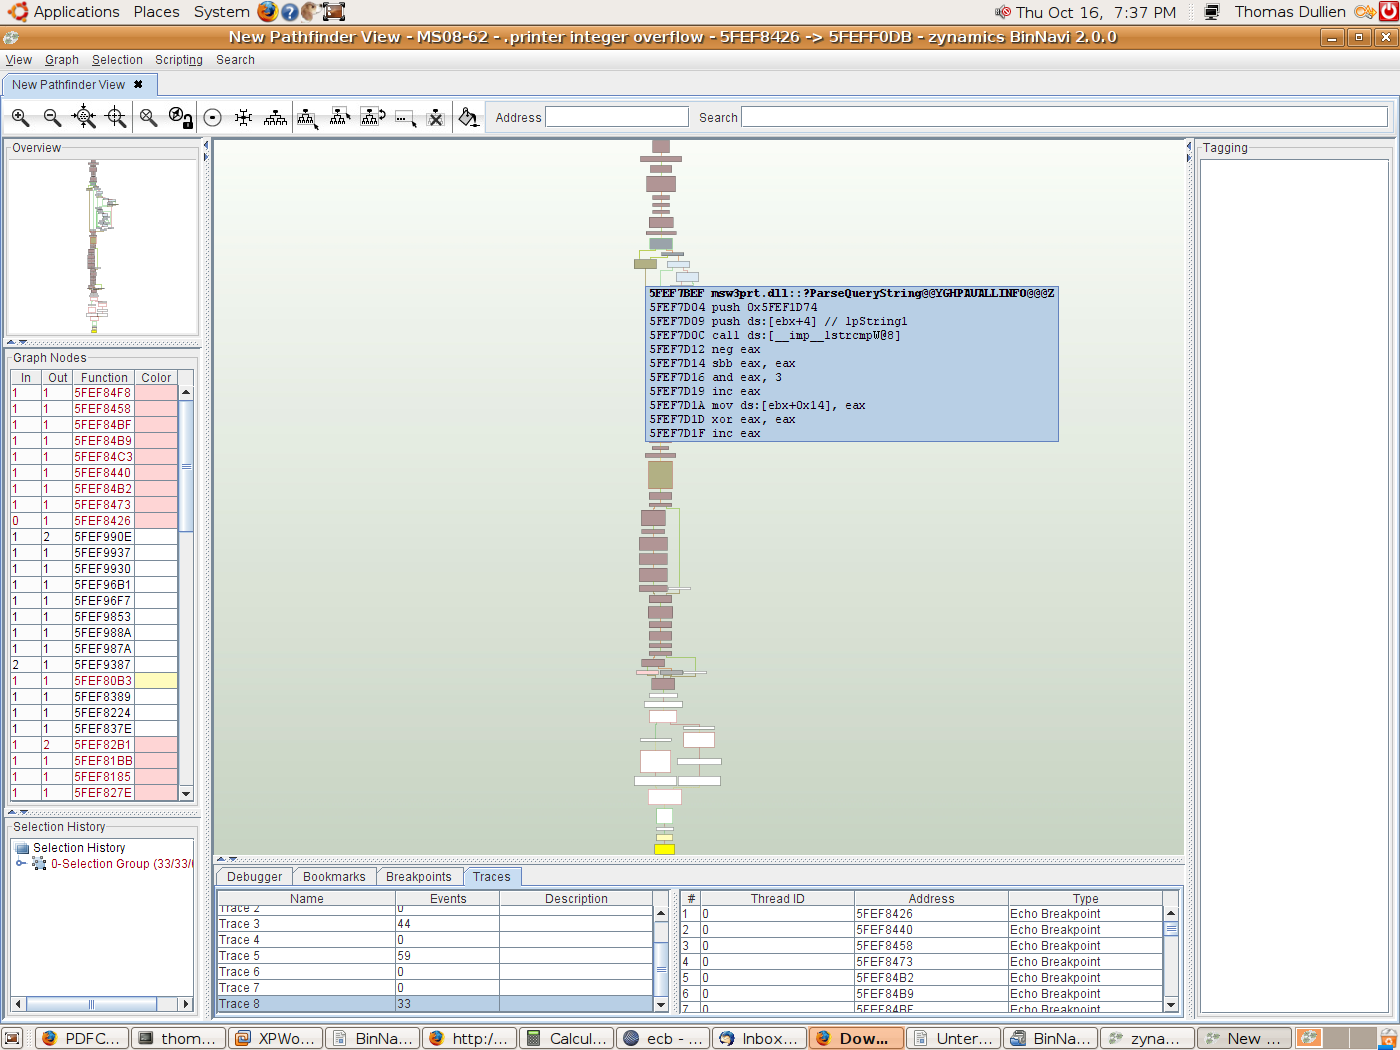
The string that 0x5FEF1D74 points to is the string "POST" -- so clearly,
we'd need to supply a "POST" request in order to get where we want to
go. What does our trace look like if we send a simple POST ?
Also, we wanted to supply a length value of 0xFFFFFFFF for the integer
overflow to work. Those of us that were around in 2002 remember vaguely
that performing a chunked-encoding post to an IIS server will call the
ISAPI in question with the cbTotalBytes length field set to 0xFFFFFFFF.
We therefore create an artificial request as follows:
POST /printers/PDFCreator/.printer HTTP/1.1
Accept: */*
Host: localhost
Content-Type: application/x-www-form-urlencoded
Transfer-Encoding: chunked
Connection: keep-alive

10
PADPADPADPADPADP
4
XXXX
4
XXXX
0
What does our trace look like now ?

We're much closer to where we want to be !
Let's have a look at the last branch in question:
5FEFF0CC mov ecx, ds:[ebx+0x14]
5FEFF0CF mov esi, ss:[ebp+arg_8]
5FEFF0D2 mov eax, ds:[ebx+0x10]
5FEFF0D5 add ecx, esi
5FEFF0D7 cmp ecx, eax
5FEFF0D9 jb byte cs:loc_5FEFF0FB
We need to be able to set ESI to 0xFFFFFFFF - so where did it come from ? Scrolling through our graph, we find it was passed into the current function here:
FEF939F push ss:[ebp+arg_18] // int
Scrolling up one more block, we see the following code:
5FEF988E push ds:[edi+0x74] // int
5FEF9891 push ds:[edi+0x78] // hMem
5FEF9894 push ds:[esi+12] // struct _IPPOBJ *
5FEF9897 push ds:[esi+8] // unsigned __int16 *
5FEF989A push ds:[esi+4] // hPrinter
5FEF989D push ss:[ebp+arg_4] // __int16
5FEF98A0 push edi // uBytes
5FEF98A1 call cs:?Spl_IppJobData@@YGHPAU_EXTENSION_CONTROL_BLOCK
Unfortunately, this implies that we have no way of triggering this vulnerability: The argument passed in comes from [edi+0x74] - where edi points to the EXTENSION_CONTROL_BLOCK structure. This structure contains two length fields: cbTotalBytes at offset 0x70 which we can set to 0xFFFFFFFF, and cbAvailable which is located at offset 0x74 which we can only control within "reasonable" boundaries.
In the same graph, we can determine that the only other path leading to
the integer overflow also passes the cbAvailable value to our target
block. This means that there should be no way of triggering the integer
overflow in question, irrespective of which path we take.