Using the Debugger
Introduction
Out of the box, BinNavi can debug 32 bit Windows user land applications (client32.exe), 32 bit Windows kernel land applications (windbgclient32.exe), 32 bit Linux applications (clientl32). Additionally it is possible to use the zynamics GDB Agent which allows BinNavi to communicate with a GDB server (clientgdb.exe). This makes it possible to debug any architecture that speaks the GDB protocol. So far the GDB debugger has been used successfully on architectures as diverse as FreeBSD on x86 PCs, Cisco 2600 series routers, NetScreen VPN firewalls, and other embedded devices.
All BinNavi debuggers are remote debuggers. The advantage of this is the clear separation between BinNavi and its debuggers. The target process to be debugged must not necessarily be located on the same machine as BinNavi itself. This is especially important if you want to debug embedded devices or devices where BinNavi can not be run. Depending on what target is debugged, the BinNavi remote debuggers can communicate through TCP/IP or the serial COM port.
Concepts
- Debug Clients: Since BinNavi can not directly talk to the target process, a so called debug client is used that forwards commands from BinNavi to the target process and sends back information about the state of the target process to BinNavi. Debug clients exist for several platforms.
- Relocation: When started, some target processes are loaded to a memory address that is different from than the one specified in their file header. In this situation, static addresses of disassembled instructions differ from their real addresses in the target process. To make BinNavi work with relocated images it is necessary to configure image base address values and file base address values.
- Trace Mode: Trace mode is used to record execution flow. When trace mode is started, special breakpoints are set on all basic blocks. Hits of these breakpoints are recorded and put into a sequence of events called a trace log. Trace logs tell you what blocks are hit during execution of the target process. This makes it easy to find out what parts of the code were executed and what parts were not executed. Previously recorded traces can be accessed from the Traces tab in the debugger panel.
- Multi Module Debug Mode: Multi module debug mode can be used if an application has been split up into multiple libraries. To use this mode all related modules can be loaded into a project. Once all modules are part of the project a combined call graph can be generated to connect the resolved imports to the appropriate libraries. Then the configured project debugger can be used to debug the complete application or the subset of interesting modules configured in the project.
Quick Start
Q: How do I debug a target application?
A: You need to configure a debugger for the module/project you want to
debug. This is done in the main window. Once the debugger is configured,
you have to start the appropriate debug client. Then you can connect to
the debug client from the Debugger panel in the graph window of the
debug perspective.
Q: How can I switch to the debug perspective?
A: The debug perspective is available in the graph window by either
pressing the key combination CTRL+ALt+D or by using the Window Menu
option in the topmost menu. To return to the standard perspective the
key combination CTRL+ALT+S can be used.
Q: How do I set or remove breakpoints?
A: Hold CTRL and right-click on the disassembly line you want to put a
breakpoint on/remove a breakpoint from. Or use the provided context menu
of the code node you would like to set a break point on.
Debugging Architecture
BinNavi does not debug any processes itself. The actual debugger logic is implemented in the so called debug clients which are available for each platform supported by BinNavi. BinNavi merely communicates with the debug clients and displays the debugging information gathered by the debug client. You can find the debug clients in the debug directory of your BinNavi installation.
- client32.exe is the Windows debugger for 32 bit user land applications.
- clientl32 is the Linux debugger for 32 bit user land applications.
- windbgclient32.exe is the Windows debugger for 32 bit kernel land applications.
- clientgdb.exe is the Debugger to speak with a remote GDB server and debug via the GDB protocol.
The source for all debug clients that ship with BinNavi as well as the needed library components can be found in the debug directory of the BinNavi installation. For details on how to build the clients please refer to the readme files in the same directory.
Once you have chosen the appropriate debug client for your target application you can start the debug client from the command line. If you start a debug client without any additional command line arguments a list of all possible command line arguments is shown. Please refer to the readme files of your preferred debug clients for more information about these command line switches.
All communication between BinNavi and the debug clients goes through a TCP/IP connection. Typically a debug client listens on port 2222 for incoming connections from BinNavi. Once the debug client receives a BinNavi connection, information about the target architecture and the target process is sent to BinNavi and you can begin to debug the target application.
Setting up Debuggers in BinNavi
The first step to debugging a target application from BinNavi is to set up a debugger. Since BinNavi can work with many different debuggers at the same time, it is necessary to set up a few standard debuggers which you can assign to modules and projects.
To set up a new debugger please right-click on a Debuggers node in the main window and choose Create Debugger. A new debugger configuration is created and a corresponding node is added to the Project Tree. Now it is necessary to configure the location of the debug client for the new debugger. By default the new debugger template can be used to communicate with a debug client that is listening on port 2222 at localhost. If the debug client you want to use is located elsewhere, you have to change the host and port information of the debugger template.
The new debugger template can be used to debug different target applications. Usually you would set up a few standard debuggers with names like Windows Debugger, Windows Remote Debugger, or Linux Debugger. If you want to debug a new BinNavi module you can choose from one of their debugger templates and assign that debugger template to the module or project you want to debug.
Assigning an existing debugger template to a module or project is simple. To set up a debugger to be used with a module, simply select the Module Node of the module in the Project Tree and select the debugger you wish to use in the Debugger combo box. Afterwards hit the Save button and from now on you can use the debugger to debug this module. Setting up a debugger for a project is comparable to setting up a debugger for a module. The difference is that more than one debugger can be assigned to a project and therefore there is no debuggers combo box but a debuggers list box. After you have selected the corresponding Project Node of the project, simply select the debuggers you wish to use with the project in the list box on the right side of the window.
Debugging with BinNavi
Once you have assigned a debugger to a module or project you can open graphs that belong to the module or project and debug them.
The first step in starting the debugger is to start the debug client you want to use to debug your target application. Depending on what debug client you are using, you have to give the debug client different command line arguments. Please refer to the documentation of the individual debug clients to learn how to start your debug client.
Once the debug client is running you can start debugging with BinNavi. Most of the interaction with the debugger is made through the debugging panel at the bottom of the graph window.
The Debugger panel has eleven different buttons that can be used to interact with the debug client. From left to right these are:
- Start Debugger: Opens a connection to the debug client. This is always the first button you have to press to debug a target application.
- Detach: Detaches from the target process. The process keeps running in the background and you can re-attach to the target process at a later point.
- Terminate: Terminates the debug client and the target process.
- Step Into: Executes the next instruction.
- Step Over: Executes the next instruction or the whole subfunction if the next instruction is a call to a subfunction.
- Step to next block: Executes instructions until the next block is reached in the graph view.
- Step to the end of the function: Executes the complete function until the end of the function is reached.
- Resume: Resumes the target process.
- Halt: Halts the target process.
- Start Trace Mode: Starts the BinNavi trace mode. In trace mode breakpoints are set on all blocks of a graph and BinNavi records all hits of these breakpoints. This makes it easy to find out what code is executed by the target process.
- Stop Trace Mode: Stops the BinNavi trace mode.
Please note that not all buttons are always available. Depending on what debug client you are using, not all options are available because the target platform might not support a debugging feature. For example, terminating the target process is generally not available when debugging embedded systems. When you debug a target process for the first time, a dialog is shown that informs you about the options available for each debugger.
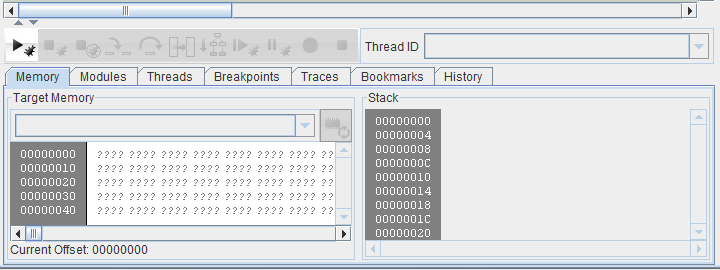
When you have successfully attached to the target process, more information about the target process is made available in the debugger panel. Depending on what is supported by your target platform, this includes information about the memory layout, a memory dump of the target process, information about the stack of your target process, information about threads used by the target process, and current register values of existing threads are shown.
If supported by the target platform, a list of allocated memory sections of the target process is shown in the combo box below the debugger buttons and the memory that can be found in the first memory section is displayed below. If automatic retrieval of memory sections is not available on your target architecture, you have to hit the Refresh button to the right of the combo box to display the memory of the target process. Once clicked, a dialog pops up where you can enter the address and size of a memory range you want to display.
The thread IDs of the threads of the target process are shown in a combo box to the right of the debugger buttons. Thread-related commands like single-stepping or retrieving the current register values are always executed for the selected thread. If you want to send commands to another thread, just select that thread from the combo box.
The current register values are shown to the right of the memory display. These register values are available for debuggers of all target platforms.
To the right of the register values, there is another small panel that provides quick access to common debugger settings. These include:
- Toggle Address Display: If checked, relocated addresses are shown in the graph instead of the original addresses. This is helpful when debugging relocated targets.
Breakpoints are one of the important debugging concepts which are not accessible from the debugger panel. To set a breakpoint simply hold down the CTRL button and right-click on a line in a code node or a function node you want to set a breakpoint on. Right-clicking on a line with a set breakpoint disables the breakpoint, right-clicking a third time removes the breakpoint. Alternatively breakpoints can be set and removed through the context menus that are shown when you right-click on a code node or a function node.
The Memory View
On right-clicking in the memory view, a context menu is made available that provides additional functionality for working with the memory of the target process.
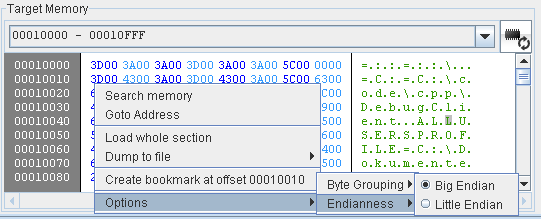
The following options are available from the memory menu:
- Search Memory: Used to search for a certain value in the memory of the target process
- Goto Address: Jumps to a given address in the memory view
- Load whole section: Loads the whole memory section
- Dump to file: Used to dump the memory section to a file
- Create bookmark: Used to create a memory bookmark at the specified address
- Byte Grouping: Changes the way data is grouped (Byte, Word, Dword)
- Endianness: Changes the way data is displayed (Big Endian or Little Endian)
The Stack View
On right-clicking in the stack view, a context menu is made available that provides additional functionality for working with the stack of the target process.
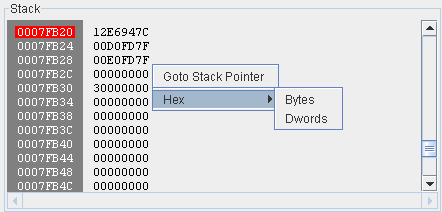
The following options are available from the stack menu:
- Goto Stack Pointer: Scrolls the stack view to make the data at the current stack pointer visible
- Hex: Switches between different display modes for stack values
Debugger options
The debugger options can be configured over the "show options" button in the debugger option panel on the right side of the graph window while the debugging perspective is active. The debug options tab shows which options the current debuggers offers. The exception options tab lets you configure different behavior on different exceptions when raised by the debugger. The debugger events tab lets you configure what will happen on module load and unload.